Once again I am back with a solution inspired by my fellow MVP Amey Holden. Here’s the challenge:
In a #MSDyn365 Marketing email, how do we show a list of one or more associated records connected to the recipient Contact AND filter those records to show just those that meet certain criteria? Let’s look at one way to accomplish this.
With Dynamics 365 Marketing it is possible to add associated records in the body of an email using the Handlebars.js markup language. Microsoft has some good examples in their documentation here. For example, if you want to send a list of Appointments that are related to a Contact, you would use this code snippet:
Tip: Before you can reference data in expressions like these, you need to make sure the entity is syncing to the Azure services behind Dynamics 365 Marketing. Under the Marketing app’s Settings area, locate the Dataset Configuration list and check the box(es) next to the entities you want to reference and publish your changes. Also, if you add an entity for this purpose, you will need to update the security role “Marketing Services User” to permit it to at least “Read” the entity.
In my example above, a contact who has two open appointments and one closed appointment would receive an email that looks like this:
Notice that the first appointment is in the status of “Completed”. What if I only want to show the open appointments? What you’ll need to do is add a nested “if” statement inside the list to first check the status, and then, only if it meets the proper criteria, write it out in the body of the email.
One thing I learned is that even though the status gets written into the body of the email as the text value “Completed” or “Open”, the if/else logic is going to compare the index value. For the out-of-the-box activity status fields, 0 is the index value for Open. So here’s the code to list out only the open appointments:
Per request of Amey Holden, here’s how to pre-define the default colors for objects that users will use to create their email and page templates in Microsoft Dynamics 365 Marketing.
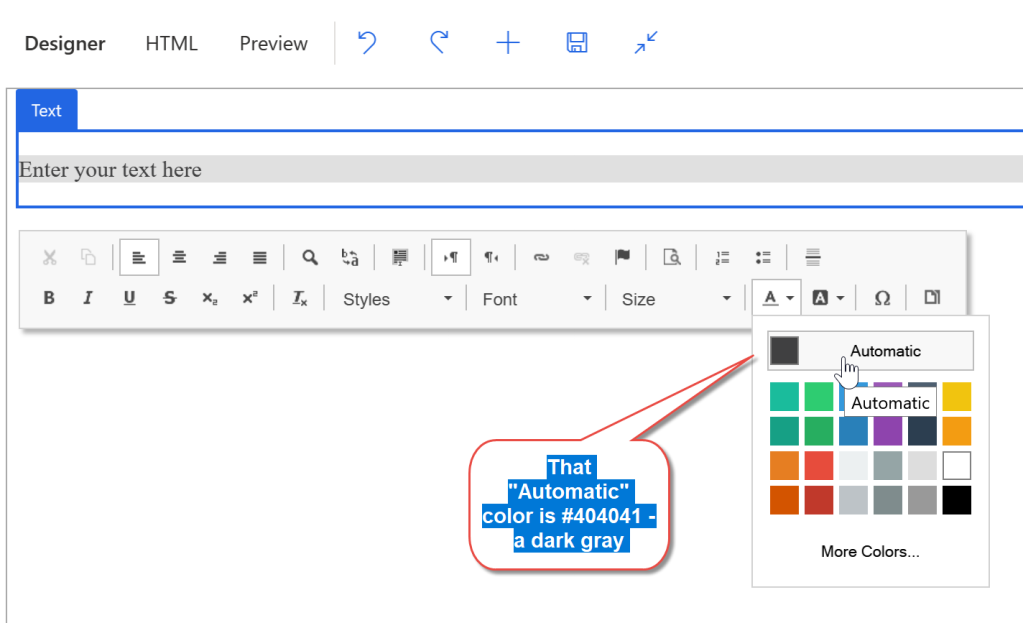
In this example, when a user drags a Text block into a landing page template, we want the default font color to be #404041 and the background color to be #E0E0E0.
Add this code inside the <head> tag of your template’s HTML:
We are using a CSS selector to set a style for every Text block. The text blocks are always divs with an element ‘data-editorblocktype’ that equals “Text”. The CSS above sets a default background color of a light gray (#E0E0E0) and the font color of #404041.
The result is that when a user drags a Text block onto the designer canvas, it will use these styles by default, and the color palette will show our color as the “Automatic” default color:
Out of the box, Microsoft Dynamics 365 Marketing’s email and page designers include only web-safe fonts – the ones that no marketer ever has wanted to use:
Boring web-safe fonts
Here’s how to add custom fonts and make them show up in the drop-down so your users can work with them easily.
TIP: Do this in the Email Template or Marketing Page Template so that when your users use one of those templates to begin designing a new email or page, they’ll automatically have the new font.
STEP 1: Get the embed code for your custom font. I like Google’s Font library – lots to choose from and easy to get the embed code. We need the <link> code below:
Add this <link> code to the head block in your template’s HTML:
STEP TWO: Add the <meta> tag that turns on additional fonts.
If you are new to Power BI or if you have not done a lot with it, it can be a little overwhelming to know where to start. In just about every sales deployment, you will have requests from both salespeople and sales managers for ways to get actionable and accurate intel on the performance of individuals and the team.
Of course, you can accomplish quite a lot with the built-in views, charts and dashboards that are available out-of-the-box with Dynamics 365 Sales, but eventually you may find that you run into some limitations. For many years, when considering advanced analytics, the primary recourse was to build an SSRS report – which is still an option. SQL Reporting Services is great, but it can be complex even if you are familiar with the tools and the skills needed to build these types of reports.
Power BI also requires some skills, of course, but I find it is much easier to get started with. A great place to start is a powerful set of reports and dashboards that Microsoft makes available on AppSource for free (assuming you have the licenses for Power BI), called “Sales Analytics for Dynamics 365 Sales”. Let’s take a look at what this provides, and how you might use this as a starting point in your organization and then build on it.
You can see that there are tabs along the left with a variety of different focuses on sales performance, and a rich set of charts and graphical views of your sales data. On the right are filters that allow slicing and dicing the data intuitively.
After you install the app from appsource into Power BI, you’ll be prompted to connect by entering the URL of your Dynamics 365 Sales instance. Note the advanced option that allows you to automatically refresh the data – the Advanced area is collapsed by default so it is easy to miss this!
On the next page, you’ll need to authenticate to Dynamics. From the dropdown, choose the OAuth2 method and then the “Organizational” type. This allows you to use your Office 365 login to authenticate from Power BI to Dynamics.
After installing this Power BI app and connecting, your data will be queried and pulled into Power BI. You will have a new workspace that contains a tabbed report. Within the workspace you will find the new dashboard and the reports that make it up. It’s helpful to explore these and the Dataset that is created. If you want to go further into seeing how this was built, you can download Power BI Desktop which provides you with a richer set of tools for designing Power BI reports.
Of course, salespeople and sales managers may not want to log into Power BI and see all of these things, which is why Microsoft has delivered this set of reports as a Power BI app.
Making This Power BI App Available in Dynamics 365
Let’s look at how we can make this available to our sales users without forcing them to leave the Sales app in Dynamics.
First, make sure the report is shared with your Dynamics users. You can either share it directly with individual users, or, as a better alternative, share it with an Office 365 Security Group that contains your Dynamics users.
Next, within Power BI, navigate to the report and click File > Embed. You’ll get two options: a direct link to the app, and iframe code you can use in your own HTML.
Option 1: Add a link to the Sales app’s sitemap to open a new tab for the Power BI app
One simple method to add this to Dynamics is to edit the “Sales Hub” app and modify the sitemap to add a direct link to this dashboard. It will open a new tab for users directly to the Power BI dashboard.
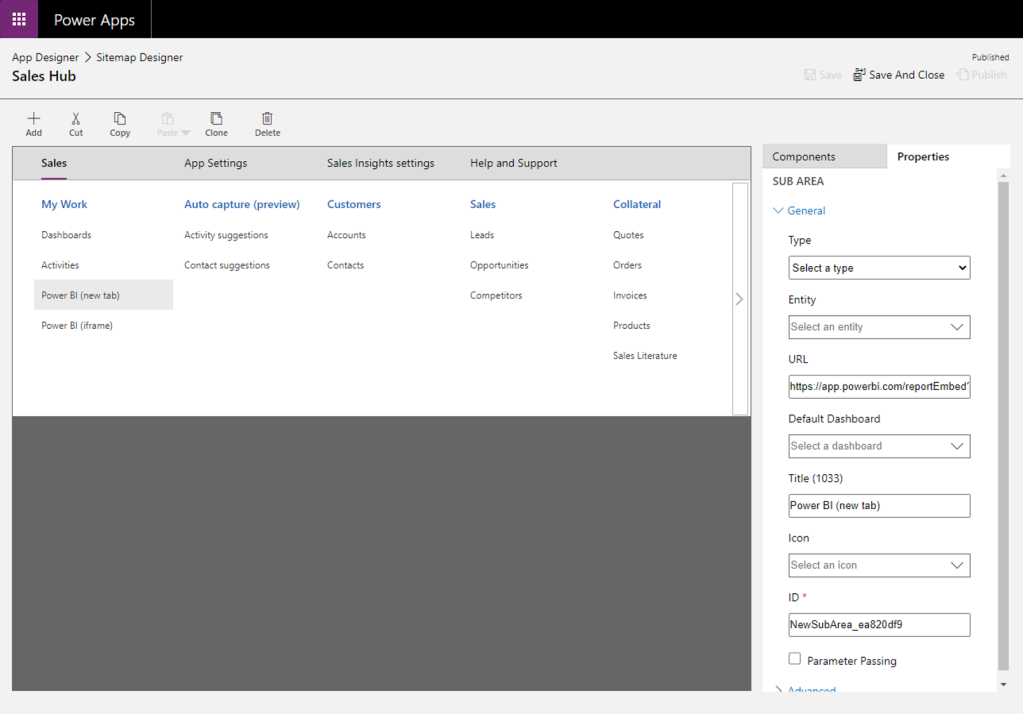
In the Power Apps maker portal (make.powerapps.com) find the Sales Hub solution and double-click the Sitemap to edit it. Add a Subarea and set the “Type” as URL. Then simply paste in the URL from the Power BI embedding options:
Publish your changes, and you will have a new sitemap in the Sales Hub app with a link to the Power BI app. It will open it in a new tab or browser window for your users.
Option 2: Add a Web Resource to the Sitemap
I like this option better, but it takes slightly more effort. First, in the Power Apps maker portal, create a new Web Resource. Select the type as “HTML”. You’ll need to add the HTML for the opening and closing <html> and <body> tags. Then simply paste in the iframe code from the Power BI embedding option:
TIP: Change the width and height of the iframe to 100% so that the Power BI takes up the entire frame within Dynamics.
The result is a rich set of dashboards, charts, and analytics, easily accessible to your Dynamics Sales users:
Hope you find this helpful! From here, you can begin to build on the out-of-the-box Power BI by adding your own reports, charts and analytics, leveraging the dataset the app has created for you in Power BI.
James Phillips presenting the 2020 Wave 1 virtual launch from home
Customer Insights was first on the agenda again! (It was also highlighted first during the 2019 Wave 2 Virtual Launch.) This time around, the use case that was shared was UNICEF’s use of Customer Insights and its integration with Dynamics 365 Marketing. Power BI, Azure, CE and F&O also got mentions in the video. You can watch the video about UNICEF here: UNICEF inspires donors with Microsoft Dynamics 365 Customer Insights. (This video is a favorite of mine since it was filmed at UNICEF Netherlands – I miss hearing that great Dutch accent!)
After a further introduction, Satish Thomas, the PM for Customer Insights, dived further into the CDP platform. Satish described some of the highlights in this release.
High-level overview of enhancements to Customer Insights in this release
Some of the most interesting updates include new ways to enrich your unified customer profiles. Prior to this release, enrichment was limited to Microsoft Graph data related to brand affinities and category interests. This release will add new enrichment options that include contact data from Informatica, firmographic and address data from Microsoft Graph, location data from HERE Technologies, and media habits from CivicScience. Satish indicated that in addition to the new enrichment options becoming available with Wave 1, there are plans to continue to grow this list.
New enrichment sources
Another enhancement is the addition of new export destinations, including Azure Blob Storage; an API Connector; Power Apps, Power BI and Power Automate connectors, and LiveRamp omnichannel marketing.
New export destinations for Customer Insights
Another segment of the launch focused on Dynamics 365 Commerce, which included out-of-the-box integration with Customer Insights in the POS solution to allow retail workers to easily understand their customers and identify the next best action.
There were tons of other new features and enhancements announced across the entire Dynamics 365 and Power Platform stack. Dynamics 365 Marketing is seeing huge investments in features like simple integration to consume Customer Insights segments, A/B testing of emails in Customer Journeys, and smart scheduling of emails for optimal send times.
I want to let you know about someone who represents the very best of our community and who needs your help today.
Over the last16 years in working with Microsoft Dynamics, I have been fortunate enough to personally meet thousands of people in the Dynamics 365 and Power Platform community. From partners to customers, developers to low code advocates, they are the most creative, passionate, funny and often wacky individuals. We are all lucky to have a community that is so rich and diverse, and unfailingly generous.
Britta Rekstad, aka @MacGyverCRM, embodies all of the best things about our community. If you don’t know her, let me tell you that she is in fact the only really humble Microsoft MVP you will ever come across. She is not a self-promoter. In fact, she is a promoter of others. I was most impressed when I learned a few years ago how she had given up many lucrative opportunities that came her way as a skilled MVP so that she could focus on mentoring and training women who had no IT background and who had encountered difficult circumstances. Britta was passionate about her mission to help these women build a career and a rewarding life by introducing them to the technology and the community that we all love.
She is not a self-promoter. In fact, she is a promoter of others.
I knew that Britta had been fighting a challenging battle with a rare illness, but until a couple of months ago I did not realize how it had worsened to the point that it has all but taken her out of action in our community and drained away her finances. As a community we are all poorer for it.
She has some close friends who have set up a CaringBridge site where you can learn more, but I want to personally challenge you to take a few minutes, get out your bank card, and donate on her gofundme page. If you have benefited from this amazing community, now is your chance to give back.
File this one away under lessons learned. Recently I was updating a demo environment of Customer Insights that I had originally set up to use one set of enrichment parameters. The original settings used Brands and Categories related to coffee retailers, but for the purposes of a new demo, I wanted to update the environment to see what types of enrichment I could get for financial services and use this information to build new segments. In the Enrichment area, I updated the brands and categories to use some familiar names and topics related to financial services:
After making these changes, I ran the Enrichment again:
However, when I viewed my Customer Cards (profiles) they still showed their affinity for coffee related brands like Starbucks and categories like coffee roasting.
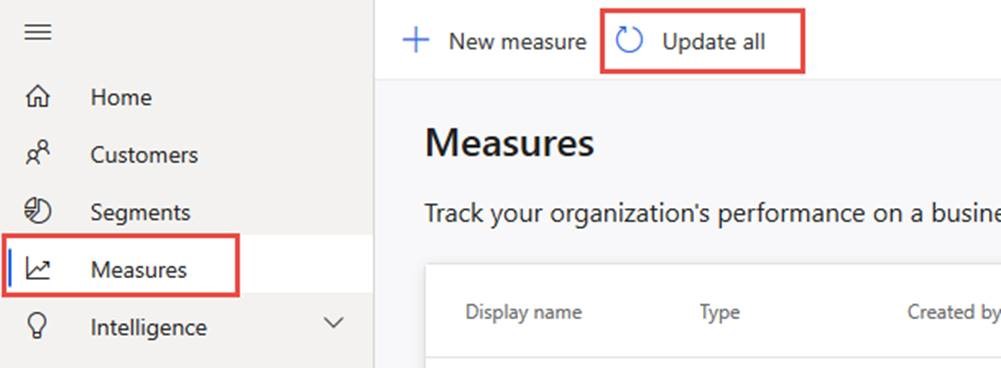
After reaching out to Microsoft, I learned that Customer Insights takes a snapshot of the profile data in order to maintain consistency of the data. To update the snapshot and see the most recent enrichment on the profiles, it was necessary to update the dependent Measures and Segments as well:
It makes sense: Your segments and measures might make use of the enriched data, so you wouldn’t want them to be out of sync after you change the enrichment parameters. Once I updated these, I now was able to see my updated profiles and use this data to make new segments.
A common question that comes up when you begin to discuss Customer Insights and its ability to unify and report on your customer data is: “Why can’t I just use Power BI for that?” I thought it might be helpful to provide some bullet points to help clarify how Customer Insights is differentiated from Power BI.
Artificial Intelligence/Machine Learning: Customer Insights leverages sophisticated algorithms to help match customer records from disparate systems that don’t have IDs or keys in common.
Common Data Service (CDS): Data that you ingest into Customer Insights can be mapped to CDS entities. For example, if you connect a contact from your order processing system, you can map it to the CDS “Contact” entity. Or if you bring in lead data from salesforce.com, you can map it to the CDS “Lead” entity. This is an optional step, but it allows you to begin to normalize your data so it can be used in other applications.
Extensible Machine Learning Models: Once you have unified your data in Customer Insights you can leverage the UI to create measures and KPIs. But you can also extend this functionality by incorporating custom machine learning models by consuming them from Azure Machine Learning Studio.
Third-party Data Enrichment: In addition to unifying the data you own internally, you can overlay third-party data to enrich your customer profiles. Microsoft makes this easy with built-in enrichment functionality from the Microsoft Graph to help you understand your customers’ potential interests and brand affinities.
Segmentation: Customer Insights allows you to create segments (both static and dynamic) that span attributes across your unified and enriched data sources. These segments can be leveraged in your marketing automation system, with built-in connectors to Dynamics or by exporting the segment for use in another application. (In upcoming releases, Microsoft will also have “recommended” segments generated by algorithms that spot patterns and opportunities in your customer data that you might not otherwise look for.
Integration with Power Platform/Dynamics: This may not strictly be a differentiator from Power BI, as of course Power BI also integrates nicely with its family of products. But Customer Insights offers a pre-built solution that can be installed in Dynamics 365 Sales to add customer cards/measures to the Contact forms so you can quickly leverage your unified data. There are also connectors so you can build Power Automate Flows/Automations (do we still call them Flows?), Power Virtual Agents, Power Apps, etc., that leverage your unified customer data.
Time-to-Value: Another huge differentiator between Customer Insights and Power BI (and most other BI tools) is the time-to-value. Connecting to multiple data sources, normalizing them, matching them, and extracting meaningful, actionable insights can be a huge undertaking. Not only does Customer Insights make this process fast and easy, it is UI-driven, meaning you can get to these valuable insights without having to resort to code and complex queries.
Approachability/Relevance to Marketers: While Customer Insights is not intended to be an “end user” application, it is designed so that marketing analysts and professionals will feel comfortable working in it. While both Customer Insights and Power BI may benefit from having a data analyst involved in the initial setup and configuration, I would argue that even a seasoned marketing professional might have difficulty extracting ad hoc data from Power BI. But they can quickly become adept at building segments in Customer Insights for use in their marketing efforts.
Customer Profiles with Demographic, Behavioral Data and Activities: The old saying about “if your only tool is a hammer, every problem looks like a nail” comes to mind. Power BI is powerful and allows you to present data in many ways. But it is a general or horizontal tool for data analysis and reporting. Maybe it is more of a Swiss Army knife as opposed to a hammer. Customer Insights, on the other hand, is focused specifically on understanding your customer and the data points surrounding your customer – how they interact with your website and other marketing channels, what they purchase from you, their interests, etc. For professionals, it is often better to have a tool that is specifically crafted for a specific job, rather than a general-purpose tool that “almost” does the job as well.
Data Ranking: As you unify your customer data, Customer Insights allows you to choose which data source will “win” for any attribute you wish to use on the customer card/profile. For example, your e-commerce data might be more reliable for email addresses, but your CRM data is more reliable for street addresses. Your frequent flyer data might be a more reliable source of mobile phone numbers, but your support desk data might be more reliable when it comes to work phone numbers. As you bring all of this together to make a single view of your customer, you can rank which system will win if both have different data for that attribute. This would be much more difficult to achieve in Power BI (I’m sure one of my Power BI friends will tell me how to do it though!), but it’s a simple matter of point-and-click in CI.
Leapfrogging (Easy Introduction to Sophisticated Data Analysis): Customer Insights makes it easy for businesses to begin using tools and techniques that are typically reserved for very large or sophisticated enterprises. While those organizations who do not leverage CI might have to invest in expensive data scientists and months-long implementations, you can leapfrog them by quickly getting the value of these tools from Customer Insights. For example, connecting your data through the Customer Insights interface will bring your data into an Azure Data Lake. You don’t need to know anything about data lakes, how to construct them or use them, to make use of Customer Insights. But as your organization grows in sophistication, you will have a nicely managed data lake already available to leverage for other applications and scenarios. Similarly, your organization may be years away from building and using your own machine learning models, but with Customer Insights, you can begin using this technology right away and open the door much sooner to the possibilities of ML than you might otherwise have done.
Back in September I had a great conversation with Ulrik “the CRM Chart Guy” Carlsson on his Power BI podcast. We discussed the opportunity around Customer Insights as well as how it fits into the bigger story of the Power Platform. Ulrik is a great interviewer – if you didn’t catch it the first time around, have a listen:
Links highlighted in the newsletter provide a wealth of great resources to help you get up to speed on Customer Insights and customer data platforms (CDPs) in general:
Video about UNICEF Netherlands (I love this one especially since they are based not far from where I used to live in The Hague)
Watch a recorded webinar about personalizing (requires registration)


You must be logged in to post a comment.